Script Debugging
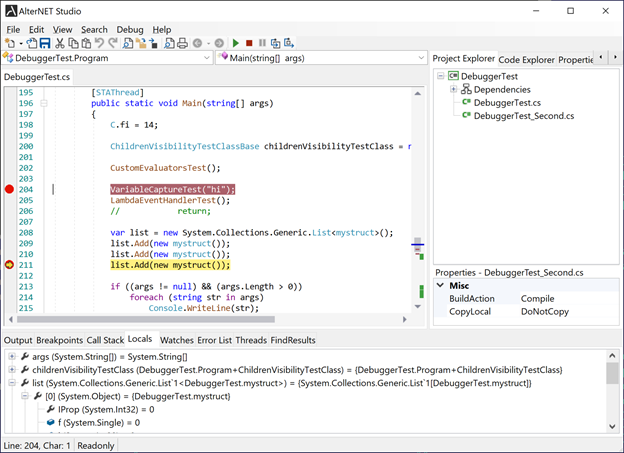
A lot of times, an application developer needs to allow users to debug the scripts they write. We provide tools to debug script code and a set of UI widgets to build custom debugging interfaces.

C# and Visual Basic Script Debugging
Script Debugger engine is implemented in Alternet.Scripter.Debugger assembly, and it is based on CLR debugging COM interfaces low-level API to debug .NET applications.
https://msdn.microsoft.com/en-US/library/ms404484(v=vs.110).aspx
The main component of script debugging is the ScriptDebugger class. It provides all commonly used debugging features like step-by-step execution, stopping on breakpoints, examining local variables, expression evaluations, etc.
Below is a summary of ScriptDebugger most essential properties, methods, and events:
Methods:
StartDebugging() - starts executing the program from the entry point.
AttachToProcessAsync - Attaches to the already started process in which scripts are to be debugged.
StopDebuggingAsync - Stops the debugging session.
Break() - Causes the given process to pause its execution so that its current state can be analyzed.
Continue() - Continues given process to the next breakpoint or until the process finishes.
StepInto() - Executes one statement of code; steps into the following function call, if possible.
StepOver() - Executes one statement of code; steps over the following function call, if possible.
StepOut() - Executes remaining lines of the function; steps out of the currently executed function.
ActivateThread - Switches debugging to the specified thread.
SwitchToStackFrame - Switches debugging to the given stack frame.
SetRunToPositionBreakpoint - Causes the debugger to stop at the specified position.
Following methods may take a considerable amount of time. Therefore they're implemented asynchronously:
EvaluateExpressionAsync - Evaluates expression in the current stack frame, with or without child properties.
EvaluateCurrentExceptionAsync - Evaluates the exception thrown by the debugger.
GetStackFramesAsync - Gets a list of method calls currently on a stack.
GetThreadsAsync - Gets a list of active threads.
GetVariablesInScopeAsync - Gets all local variables in the given stack frame.
TrySetNextStatementAsync - Sets the execution point to the specified line.
GetExecutionPositionAsync - Gets the current execution point.
Properties:
IsStarted - Indicates whether the debug process has started.
State - Gets current debugger state.
ScriptRun - in case Debugger used to debug standalone executable, contains all information required to compile and run the script.
GeneratedModulesPath - Specifies a directory where assemblies for the scripts being debugged are located.
Breakpoints - Returns collection of debugger breakpoints.
<xref:Alternet.Scripter.Debugger.ScriptDebugger.EventsSyncAction> - A function that could be provided by the application to sync raised debugger events if required (for example, perform Control.Invoke)
Events:
<xref:Alternet.Scripter.Debugger.ScriptDebugger.ActiveThreadChanged> - Occurs when the thread to be debugged changes.
<xref:Alternet.Scripter.Debugger.ScriptDebugger.DebuggerErrorOccured> - Occurs when the debugger encounters an error during debugging session.
<xref:Alternet.Scripter.Debugger.ScriptDebugger.DebuggingStarted> - Occurs when the debugging session is started.
<xref:Alternet.Scripter.Debugger.ScriptDebugger.DebuggingStopped> - Occurs when the debugging session is stopped.
<xref:Alternet.Scripter.Debugger.ScriptDebugger.ExecutionResumed> - Occurs when debugging is resumed after being paused.
<xref:Alternet.Scripter.Debugger.ScriptDebugger.ExecutionStopped> - Occurs when debugging is paused.
<xref:Alternet.Scripter.Debugger.ScriptDebugger.LogMessageReceived> - Occurs when a debug message is received.
<xref:Alternet.Scripter.Debugger.ScriptDebugger.StackFrameSwitched> - Occurs when the debugger is switched to the stack frame.
<xref:Alternet.Scripter.Debugger.ScriptDebugger.StateChanged> - Occurs when debugging state is changed (when the debugger is started, stopped, or paused)
.NET Script Debugging best practices
The main issue we've faced with debugging is that it's impossible to embed debugging logic in the same process where scripts are executed, as the debugger process will need to freeze itself when debugging. Refer to the following blog for more details:
https://blogs.msdn.microsoft.com/jmstall/2005/11/05/you-cant-debug-yourself/
Therefore we see two main options for script debugging to work:
- Script is compiled as a dynamically linked library and is linked to the calling application (which is the most straightforward way for scripts to be able to access application-defined objects). In this case Script debugger must be a separate process that attaches to the primary application process and allows to debug script code in it. The script debugger can be made look like it belongs to the same application (which is outside of the scope of this tutorial), but it has to be in a separate process.
In this mode, Script Debugger does not compile or execute the script itself; instead, it relies on the primary application. It receives the application process id, source, and project file along with the name of the assembly to be debugged via command-line arguments; attaches to the application process and communicates with it by sending Start Debug or Stop Commands and receiving a list of compilation errors or script completion events.
Refer to DebugMyScript quickstart projects for more details.
Note that you cannot debug the main application under Visual Studio and have Script Debugger attached to it simultaneously, as Visual Studio will attach its own debugger.
Note that the target platform of the debugger and debuggee process need to be the same (for AlterNET Studio demo, it's set to AnyCPU).
- Script to be compiled in the separate executable, and debugging logic is embedded in the application itself. This option requires either the script to be application-independent (which is not helpful if scripts are intended to extend application logic) or access application-defined objects via interprocess-communication. Please refer to our DebuggerIntegration/ DebugRemoteScript quickstart projects for more details.
These limitations do not apply to Python, IronPython, and TypeScript script debuggers.