Script Debugging Widgets
Scripter package includes a set of debugger widgets, toolbars, menus, and code editors available both for WinForms and WPF and can be linked to any Debugger components for C#/VisualBasic, Python/IronPython, TypeScript/JavaScript, and Debug Server Protocol-based debuggers.
These widgets include:
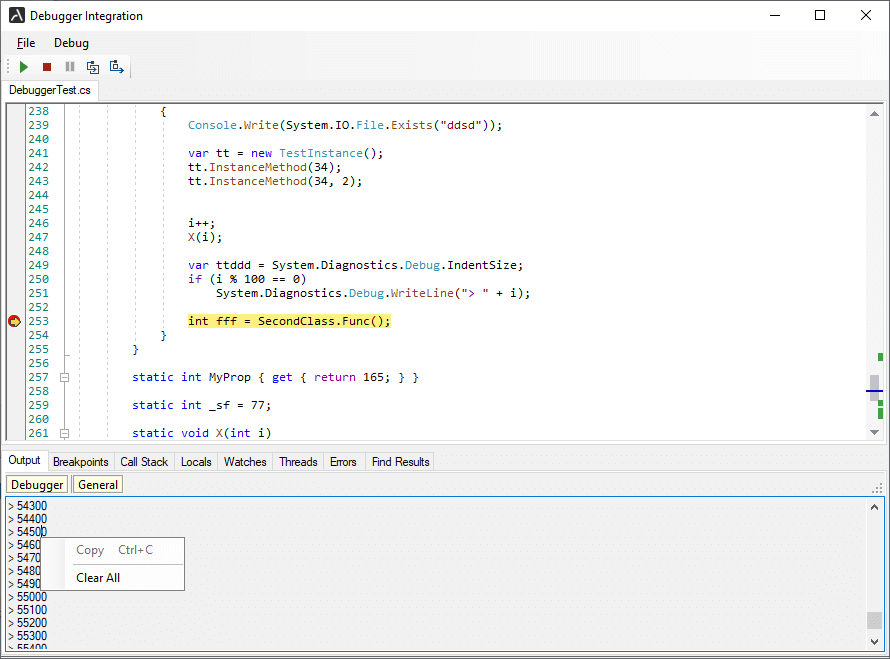
Output (Output) - to log debugger events or application-specific messages.
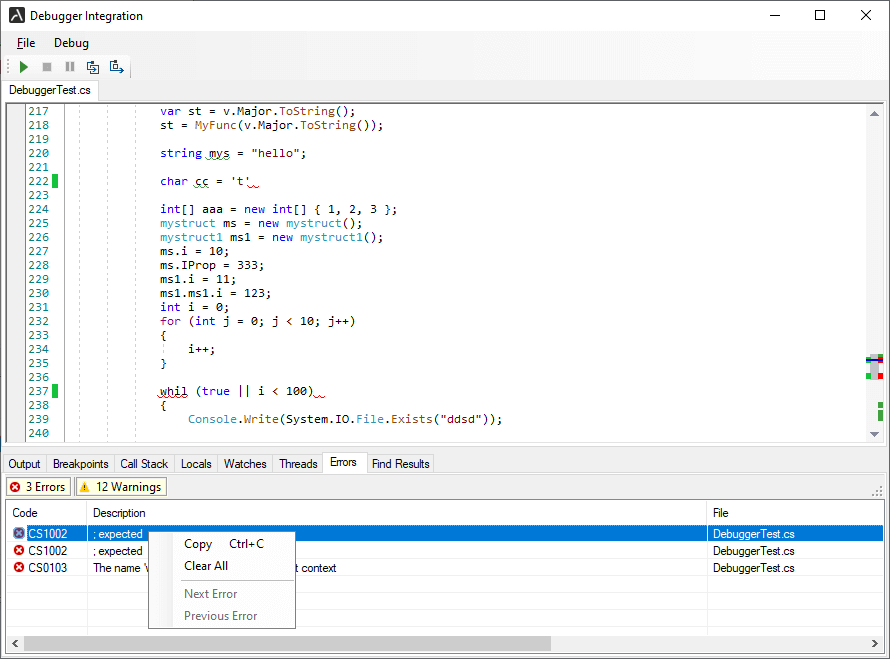
Errors (Errors) - to display a list of compilation errors.
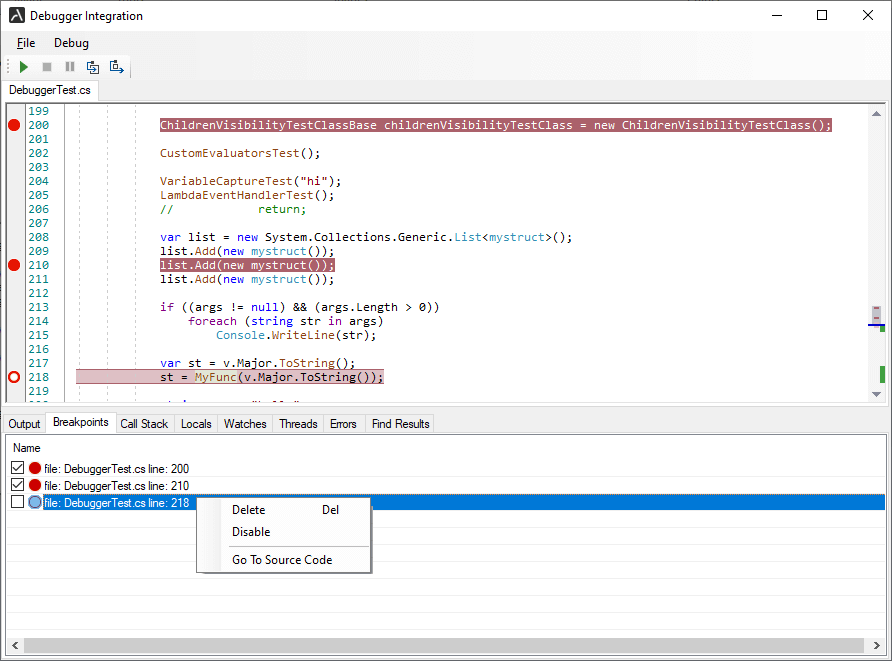
Breakpoints (Breakpoints)- to display and navigate through the list of breakpoints set in the source;
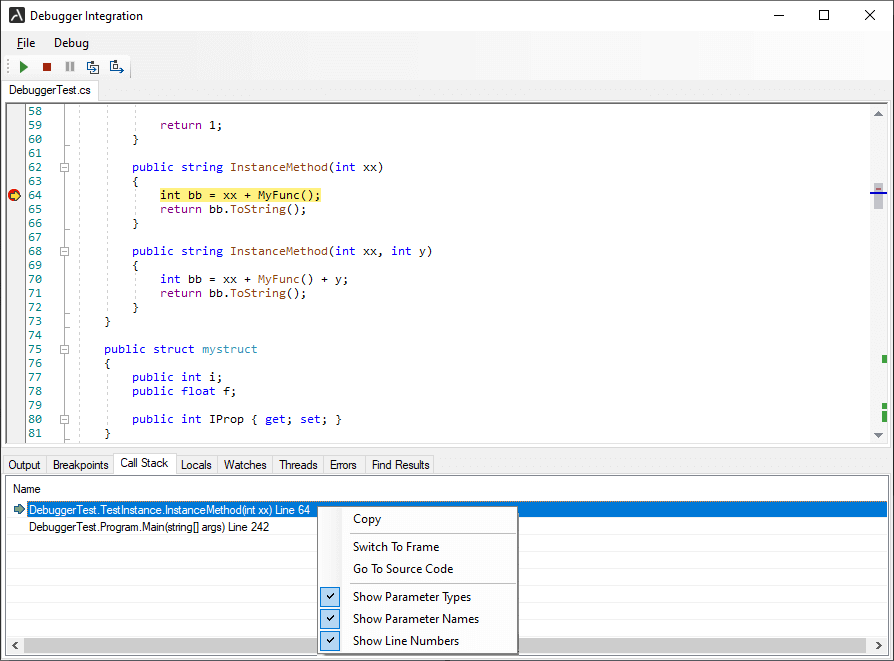
CallStack (CallStack)- to display and navigate through the list of method calls that are currently on the stack.
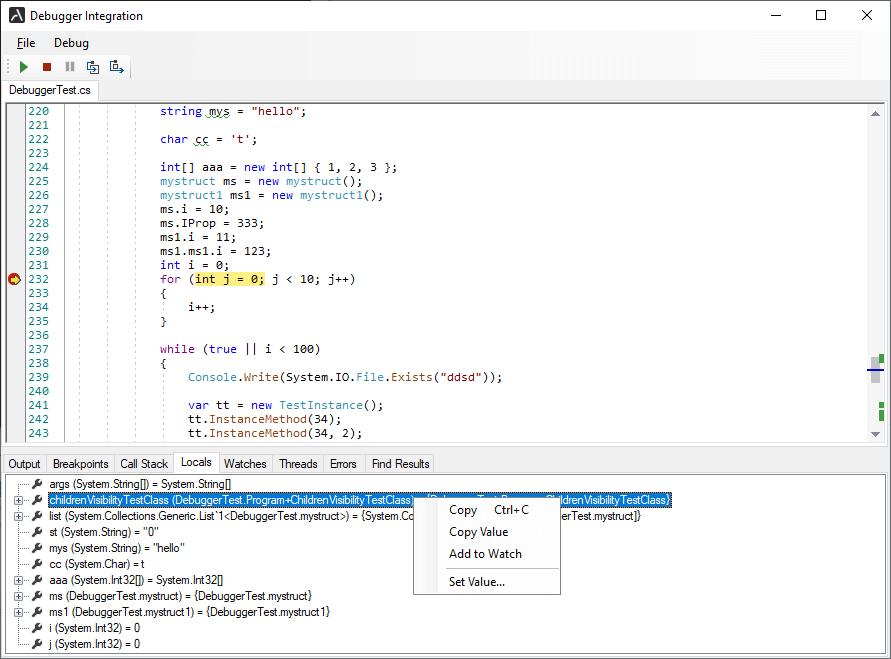
Locals (Locals)- to examine values of local variables once debugging code step-by-step.
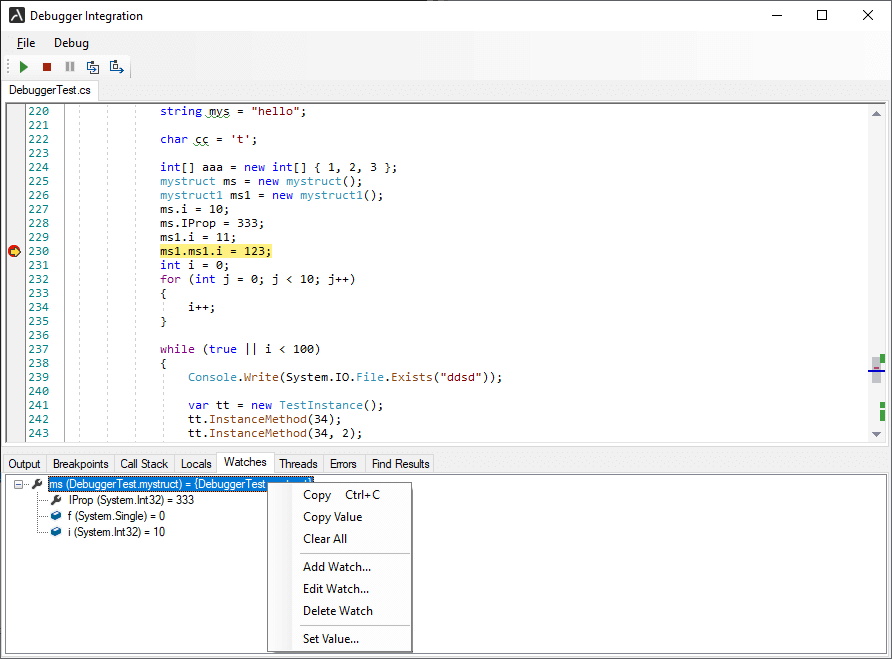
Watches (Watches)- to examine values of watch expressions when debugging.
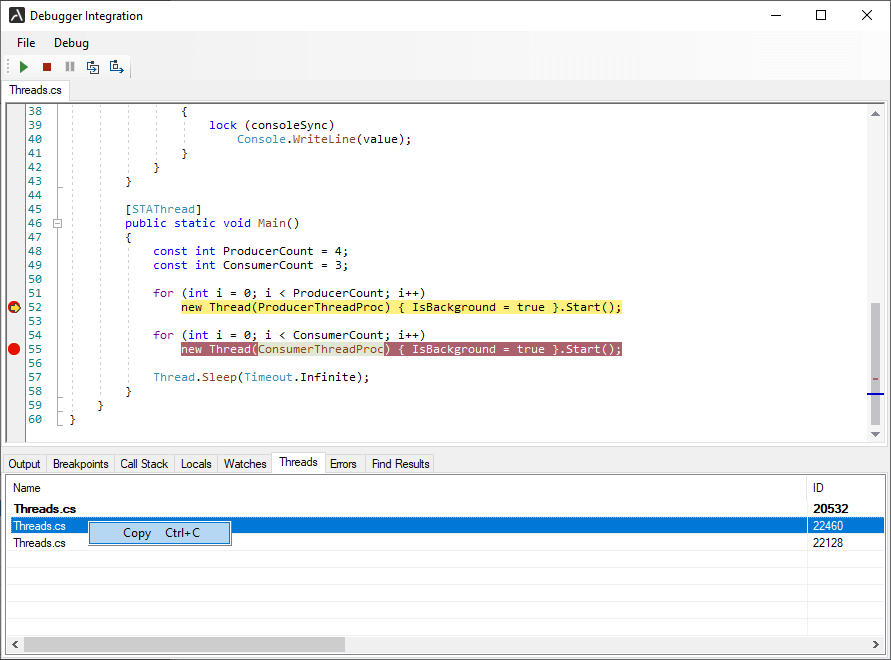
Threads (Threads)- to display active threads and switch debugging between them.
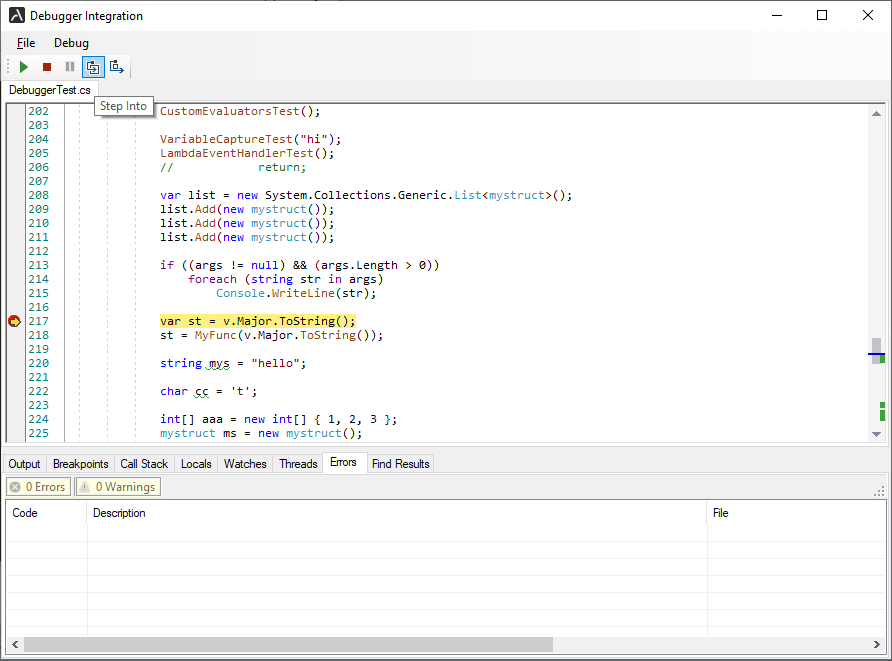
DebuggerControlToolbar (DebuggerControlToolbar)- a toolbar with buttons executing Run/Stop/StepInto/StepOver commands.
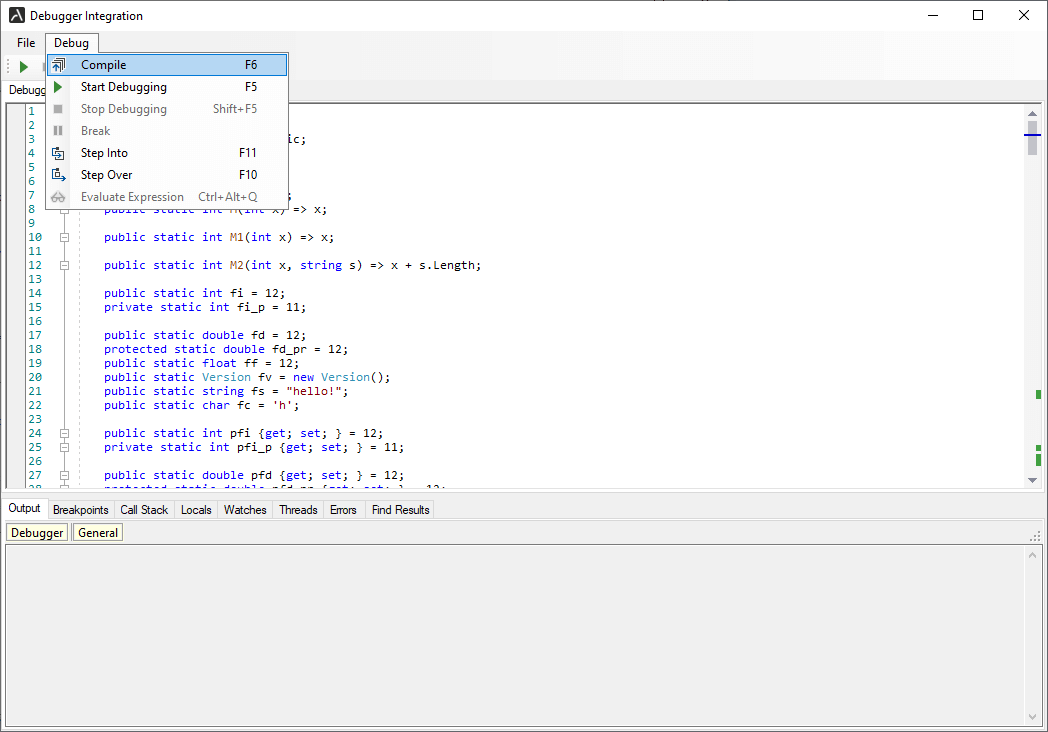
DebugMenu (DebugMenu) - menu with menu items executing Run/Stop/StepInto/StepOver commands.
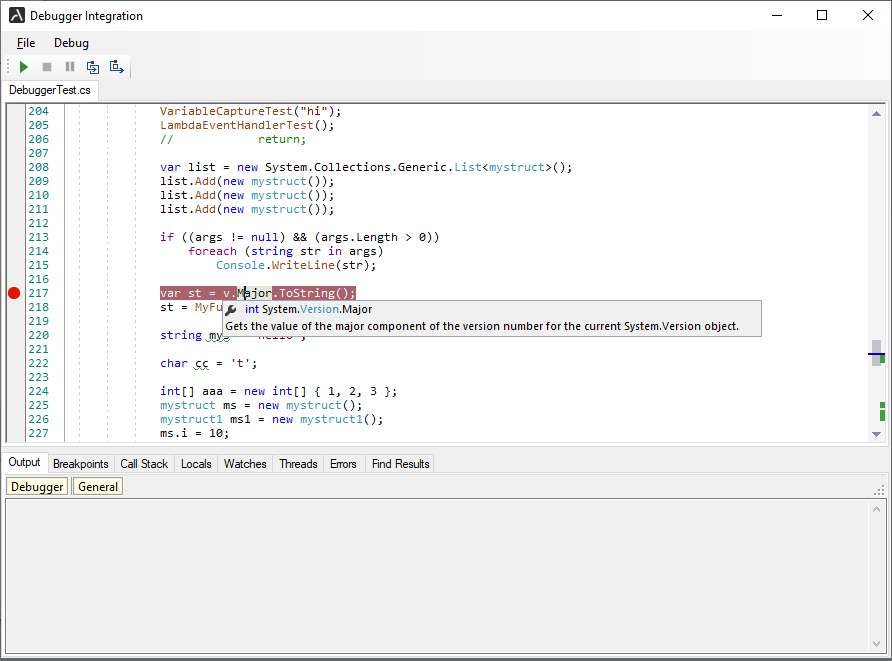
DebugCodeEdit (DebugCodeEdit) code-editing controls designed to work with the Script debugger; these controls allow the user to set or remove breakpoints and evaluate expressions by hovering the mouse over the symbol during debugging.